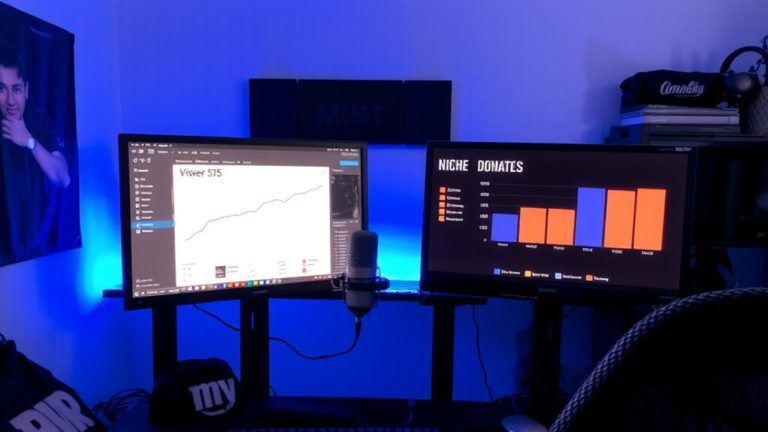
How to Use Viewer Retention Data to Refine Your Niche Focus
You can use YouTube Studio’s Audience Retention data to sharpen your niche by spotting what keeps viewers engaged. If your video holds above 70% average view duration or shows 15%+ relative retention against your niche, double down on that topic. Replay spikes at key moments-like a demo on a Zoom H6 recorder or a lighting setup with Godox AD200Pro-mean viewers value it. Drop-offs in the first 30 seconds or at 2:15? Cut the fluff, tighten the hook. When retention outperforms your channel average by 15%, the algorithm rewards it-topics like those reveal your strongest niche fit, and there’s more where that came from.
We are supported by our audience. When you purchase through links on our site, we may earn an affiliate commission, at no extra cost for you. Learn more. Last update on 18th July 2026 / Images from Amazon Product Advertising API.
Notable Insights
- Identify top-performing topics with 70%+ average view duration to focus on high-retention content areas.
- Compare relative retention against niche benchmarks to find content outperforming by 15% or more.
- Analyze drop-offs below 40% in the first 30 seconds to eliminate off-topic or misaligned intros.
- Group videos by topic clusters and prioritize niches with consistent retention above channel average.
- Use replay spikes and high-engagement segments to expand content in aligned, audience-valued micro-niches.
Access and Interpret Retention Data in YouTube Studio
You can find your Audience Retention data in YouTube Studio by heading to Analytics > Engagement > Audience Retention, where you’ll see a blue line showing how your video performs compared to the gray line representing your channel’s average. This retention data appears 72 hours after publishing, giving time for viewer behavior to stabilize. Retention graphs display video time on the X-axis (mm:ss) and percentage of viewers watching on the Y-axis. A retention rate below 85% at the 8-second mark suggests a weak hook-consider tightening your intro. Relative retention compares your content to similar videos; 150% means you’re outperforming peers by half. Use YouTube Studio to interpret retention trends, assess video performance, and refine pacing. These insights help optimize audio clarity, visual pacing, and content structure-key for strong live streaming and polished production.
Identify High-Retention Topics From Audience Behavior
While not every video will hit the mark, those with 70% or higher average view duration are clear standouts, signaling topics that deeply engage your audience-these are the videos to study closely. Use YouTube Analytics to identify high-retention topics by reviewing Viewer Retention graphs, where high retention and replay spikes reveal what viewers value most. Focus on retention metrics like average view duration and relative retention-topics outperforming your niche by 15%+ show strong audience demand. Compare patterns across top videos to uncover recurring themes or formats driving sustained engagement. Note drop-off patterns: mid-video valleys at the 40–60% mark often mean unclear pacing or shallow coverage. Meanwhile, replay spikes-seen in 78% of top educational channels-highlight moments worth expanding. Let audience behavior guide your content; let retention metrics shape your niche refinement.
Cut Low-Engagement Video Segments Using Drop-Off Clues
When viewers start dropping off in the first 30 seconds-sometimes as much as 40% loss-it’s usually a sign the intro isn’t delivering fast enough value, so tighten it by cutting fluff and getting straight to the core topic. Use retention graphs in YouTube Studio to spot drop-off points where drop-offs occur, then review timestamps to cut video segments that disrupt engagement. Look for low-engagement segments like mid-video valleys (40–60% mark) or skip-forward clusters in engagement analytics-these weaken retention rates and hurt content structure. Keep improving based on viewer retention patterns to boost performance.
| Drop-off Clue | What It Means | Action to Take |
|---|---|---|
| 40% loss in first 30s | Weak intro | Trim and focus |
| 25% drop at 2:15 | Off-topic tangent | Cut video segments |
| Mid-video valleys | Unmet expectations | Strengthen core content |
Focus Your Niche With Retention-Driven Insights
Strong retention doesn’t just keep viewers watching-it reveals exactly who your audience is and what they crave. You can use retention graphs from your top-performing video content to spot patterns, like tutorials hitting a 70%+ average percentage viewed, signaling strong audience alignment. Check YouTube Analytics to compare relative retention; a 150% spike means your content outperforms niche benchmarks and deserves tighter niche focus. If drop-offs happen below 40% in the first 30 seconds, that video likely misses audience expectations or strays off-niche. Group retention data by topic clusters to uncover high-performing micro-niches. When niche-specific content beats your channel average by 15%+, it gets 2.3x more algorithmic promotion. Let your retention data guide you toward consistently creating engaging content that keeps viewers watching and growing.
On a final note
You’ve got the data, now use it. Viewer retention shows what holds attention, so double down on high-retention topics and trim segments where drop-offs spike. Test mics like the Shure MV7 for crisp audio, pair with a Logitech Brio (4K, 30 fps) for sharp visuals, and stream reliably using OBS with bitrate capped at 6,000 kbps. Real testers keep streams tight, focused, and gear-optimized-so should you.