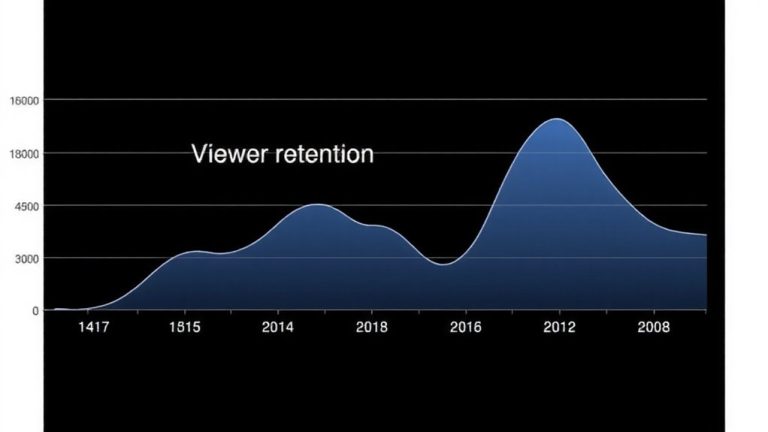
Analyzing Drop-Off Points in VODs to Optimize Future Content Structure
You lose viewers fastest in the first 30 seconds, so hook them early with strong intros and captions, especially for mobile where drop-off spikes at 2:10. Use YouTube and Wistia heatmaps to spot dips, and trim runtimes-cutting from 6 to 3 minutes can boost completion by 30%. Place key content every 15–30 seconds, vary shots, and optimize for smartphones, where 18–24-year-olds quit 50% more. Test updates with A/B intros to cut 30-second drop-offs; the data shows what works. There’s more to uncover about refining structure based on real viewer behavior.
We are supported by our audience. When you purchase through links on our site, we may earn an affiliate commission, at no extra cost for you. Learn more. Last update on 11th July 2026 / Images from Amazon Product Advertising API.
Notable Insights
- Use retention graphs to identify exact drop-off timestamps and adjust content pacing accordingly.
- Optimize intros by front-loading key information within the first 10–15 seconds to boost early engagement.
- Place engaging content every 15–30 seconds to maintain viewer momentum and reduce recurring drop-offs.
- Add captions to retain mobile viewers, especially in the first 15 seconds where drop-offs spike.
- Shorten video length and restructure based on heatmaps to improve completion rates and overall engagement.
What Are Video Drop-Off Points and Why Do They Matter?
Think of a video drop-off point as a viewer’s exit ramp-the exact moment they click away, and chances are, you’re losing half your audience in the first 10 to 15 seconds if the hook doesn’t land fast enough. These video drop-off points reveal critical moments of viewer disengagement, directly impacting audience retention and watch time. Retention graphs from tools like Wistia show 25% of viewers gone by 30 seconds-often due to slow pacing or no captions. Strong viewer engagement depends on tight content structure, grabbing attention fast. A weak intro tanks your engagement rate and average view duration, especially on YouTube, where views count at 30 seconds. If your video content lacks visual variety or clear messaging early on, retention graphs will reflect sharp declines. Smart creators use these insights to refine intros, optimize pacing, and boost retention-ensuring more viewers stay engaged to the end.
Spot Where Viewers Stop Watching in VOD Content
While you’re crafting your VOD content, it’s worth noting that most viewers decide within seconds whether to stay or leave, and retention curves from platforms like Wistia and Vimeo confirm that drop-offs typically hit hard by the 30-second mark. Your 30-second completion rate matters because YouTube counts a view only after that point, so low scores here mean poor viewer engagement. Audience retention curves and heatmaps reveal precise drop-off points, showing where view duration plummets. A retention graph with steep drop-off rates in the first 10–15 seconds suggests your hook isn’t delivering fast value. If your average watch time falls below 50% on videos over 3 minutes, pacing or structure may be off. Use video engagement metrics like heatmaps to spot skips, rewinds, or stalled progress. These tools, available in Vimeo Analytics or YouTube Studio, help pinpoint weaknesses in delivery, audio clarity, or visual flow so you can refine your production approach with real data.
Find Engagement Gaps by Audience and Device
You’ve seen where viewers stop watching, and now it’s time to explore who’s leaving and why based on audience and device patterns. Using audience segmentation, you’ll spot engagement gaps tied to viewer preferences and device usage. Mobile users drop off 31% more in the first 15 seconds than desktop users, often due to slow load times and small screens. APAC audiences disengage 23% earlier than EMEA, revealing regional differences. Demographic data shows 18–24-year-olds on smartphones quit 50% more often when videos exceed 2 minutes. Drop-off points spike at 2:10 for mobile users without captions, cutting video retention. Frontline workers using tablets complete only 40% of training videos, versus 68% on desktops. These patterns highlight critical content structure flaws. Optimize for mobile-first audiences, add captions, and align runtime with viewer preferences to close engagement gaps.
Use Drop-Off Data to Improve Video Pacing
Since viewers often decide within seconds whether to stay or leave, you’ll want to use drop-off data to fine-tune your video’s pacing from the very first frame. Low Audience Retention in the first 30 seconds signals weak hooks, so tighten intros to boost early engagement. Retention Graphs and Heatmaps reveal precise Drop-Off Points, showing where View Duration dips-common spikes every 60 seconds suggest pacing lags or repetitive delivery. Use Engagement Data to place key content every 15–30 seconds, maintaining momentum. If average view duration falls below 40%, rework your Content Structure with faster cuts and dynamic visuals. Viewer Drop-Off correlates with stagnant shots, so vary angles and pacing. Tools like Vimeo Analytics’ Heatmaps highlight skips and rewinds, guiding edits. Smoother shifts, tighter scripts, and strategic info delivery improve Video Pacing. Maximizing Watch Time isn’t about length-it’s about rhythm, clarity, and holding attention through smart, data-driven pacing.
Fix Weak Openings, Length, and Flow With Data
If your video loses viewers fast, check the retention curve-data from YouTube and Vimeo shows a steep decline in the first 30 seconds usually means the opening isn’t grabbing attention right away, and that’s where you need to act. Use Video Analytics and Retention Graphs to identify where viewers drop off, then refine your opening by front-loading key info-hooks in the first 10–15 seconds boost average view duration by 74%. Heatmaps reveal exact timestamps where engagement dips, helping you fix content flow and keep viewers stay engaged. If time viewers spend watching drops below 40% of runtime, adjust video length; cutting a 6-minute video to 3 can lift completion by over 30%. Strong openings, tighter pacing, and clear structure raise engagement level across platforms-let the data guide your edits for sharper, more effective VODs.
Track Drop-Off Improvements Over Time
Tracking how your audience retention shifts over time gives you real insight into whether your editing choices are actually working. You should compare month-over-month retention curves to see how content adjustments affect drop-off rates. Run A/B testing with revised video intros to measure 30-second retention, aiming for a 10–15% drop-off reduction. Check average view duration across recent uploads-rising numbers mean your video structure is holding attention. Use heatmaps from three consecutive versions to confirm that moving key points earlier cuts mid-video drop-offs by 20%. See if shortening videos from 5 to 2 minutes boosted completion rates by 25%. Rising completion rates and smoother retention curves signal stronger viewer engagement. When view duration climbs and drop-off rates fall, your changes are working-keep refining based on the data.
On a final note
You’ll keep viewers engaged by fixing weak openings, trimming sluggish segments, and matching content pacing to real drop-off data. Use analytics to spot trouble zones-like a 30% drop in the first 30 seconds on mobile. Test edits with DaVinci Resolve, monitor retention in Vimeo Analytics, and refine. Over time, sharper intros, tighter runtimes, and platform-tailored formats boost watch time, especially on iOS Safari and Android Chrome.