Sharing Monthly Progress Reports Featuring Key Growth Metrics From All Platforms
You save up to 30 hours monthly by automating progress reports with Whatagraph IQ, pulling key growth metrics from GA4, CRM systems, and platforms like Instagram, Facebook, and YouTube, so you can track conversion rates, ROAS, and retention in one unified dashboard, spot UX issues using session replays and scroll depth, and adjust ad spend or content strategy based on real-time behavioral data, giving your team clear, actionable direction with less guesswork and more precision. You’ll uncover even smarter ways to align metrics across your live streaming and production workflows.
We are supported by our audience. When you purchase through links on our site, we may earn an affiliate commission, at no extra cost for you. Learn more. Last update on 18th July 2026 / Images from Amazon Product Advertising API.
Notable Insights
- Consolidate data from GA4, CRM, and social platforms into a unified dashboard for comprehensive monthly reporting.
- Use automated tools like Whatagraph IQ to generate reports with key growth metrics in minutes.
- Highlight cross-channel KPIs including ROAS, conversion rate, and retention to demonstrate overall performance.
- Include platform-specific metrics such as Instagram saves, LinkedIn CTR, and YouTube session duration for depth.
- Share reports with stakeholders using AI-generated narratives and visualizations for clear, actionable insights.
Show Why Monthly Progress Reports Drive Growth
While it might seem easier to skip the monthly grind of compiling progress reports, doing them right actually fuels growth by turning scattered data into clear, actionable wins. Your monthly progress reports pull key growth metrics-like conversion rate, customer acquisition cost, and retention analysis-from tools like Google Analytics 4 and CRM systems, helping you make data-driven decisions fast. You’ll spot trends in engagement metrics, such as session duration and scroll depth, and fix UX issues killing conversions. With ROI analysis, you reallocate budgets to top-performing marketing channels, boosting returns. Automated reporting via Whatagraph IQ cuts manual work by up to 30 hours monthly, so your team stays focused. AI-powered alerts from Contentsquare catch behavior shifts early, protecting revenue. These reports don’t just track performance-they drive smarter testing, better content, and stronger campaigns across every platform.
Track the Right Metrics for Each Platform
Engagement isn’t one-size-fits-all, and your metrics shouldn’t be either. To track performance accurately, focus on platform-specific engagement and the right social media metrics. Use Instagram Insights for saves and shares, Facebook Insights for reach and video views, and track Twitter impressions to gauge real-time impact. For B2B, monitor LinkedIn follower growth and CTR. YouTube session duration reveals content stickiness, while Google Analytics 4 ties it all to conversions.
| Platform | Key Performance Indicators (KPIs) | Tool |
|---|---|---|
| Saves, Shares | Instagram Insights | |
| Reach, Video Views | Facebook Insights | |
| Follower Growth, CTR | LinkedIn Analytics | |
| YouTube | Session Duration, Unique Viewers | YouTube Studio |
| Twitter (X) | Impressions, Engagement Rate | X Analytics |
You can’t improve what you don’t measure-so track performance with precision.
Visualize Cross-Channel Performance in One Dashboard
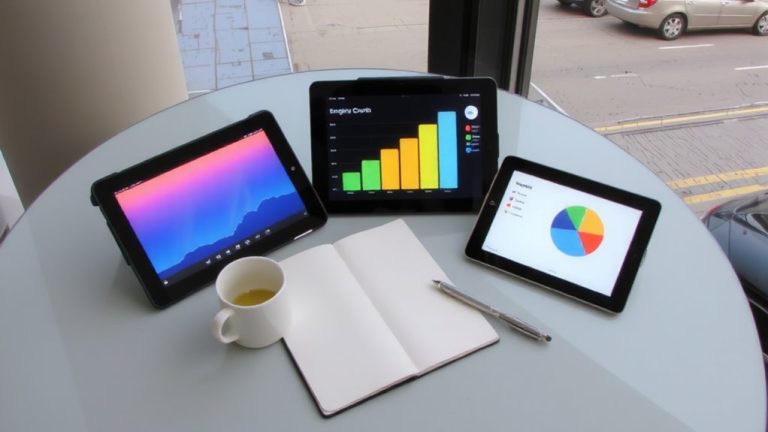
When you’re juggling content across Instagram, YouTube, TikTok, and LinkedIn, toggling between tabs isn’t just tedious-it kills productivity and clouds insight. You need a single dashboard to visualize cross-channel performance clearly. With data consolidation from platforms like GA4, Facebook, and TikTok, tools like Whatagraph and Hootsuite give you real-time tracking of key metrics-engagement, CTR, video views, ROAS. Their dashboards simplify marketing reporting by pulling social media analytics into one place, so you’re not chasing spreadsheets. Semrush and Contentsquare let you visualize trends using line charts or tables, combining SEO, PPC, and conversion data. You see all your performance data in context-no guesswork. KPIs like impressions and engagement rates update automatically, keeping your team aligned. A unified dashboard doesn’t just save time-it sharpens decision-making with accurate, live performance insights across every channel you run.
Use AI to Generate Monthly Progress Reports Faster
You’ve got all your cross-channel performance data flowing into one dashboard, giving you a clear, real-time picture of how your content’s doing on Instagram, YouTube, TikTok, and LinkedIn. Now, use AI to generate reports in seconds, not hours. Tools like Whatagraph IQ auto-populate charts and narratives, pulling key growth metrics for your monthly progress reports. With natural language queries, you can ask, “Which channel had the highest ROAS?” and get instant answers. Semrush’s AI Summary widget delivers actionable insights tailored to your campaign data, while Hootsuite’s weekly AI scores simplify monthly social media reporting. Contentsquare flags shifts in performance metrics using AI alerts, so you never miss a trend. These tools cut report creation time dramatically. You focus on analysis, not formatting. Custom metrics and data analytics feed into clean, consistent reports-giving you more time to optimize content, gear, and live streaming setups based on real results.
Turn Data Into Actionable Recommendations
Insights are only as valuable as the actions they drive, so let’s turn your data into real-world improvements for your live streaming, audio, and video production setup. Use AI to turn report data into actionable recommendations-like shifting ad spend when ROAS dips in data from Google Analytics. If conversion rates drop, inspect session replays to fix UX hiccups in your streaming software or checkout flow. Monitor churn rate monthly; if it rises, pair customer feedback with NPS® scores to launch retention campaigns. Marketing teams should compare social media analytics against competitors using Hootsuite, then adjust posting times and content types. Track key performance indicators (KPIs) like CAC and CLV-when CLV:CAC falls below 3:1, reallocate budget to high-performing platforms. Let campaign performance guide gear upgrades or content shifts. These moves turn raw metrics into growth.
Create Reports Stakeholders Will Actually Use
Now that you’re turning data into smart, actionable moves-like optimizing ad spend based on ROAS drops or using session replays to smooth out viewer checkout issues-it’s time to make sure your reports actually land with stakeholders. Use an analytics dashboard like Contentsquare or Hootsuite to consolidate data from multiple sources-Google Analytics 4, Facebook Ads, CRM systems-so you can share reports that are clear and real-time. Focus on key performance indicators (KPIs) that matter, like CLV:CAC ratio (aim for 3:1), churn, and engagement, not vanity metrics. Structure your performance report with executive summaries, cross-channel insights, and platform-specific breakdowns using proven report templates. Let AI tools like Whatagraph IQ turn complex trends into plain-language summaries stakeholders get. Automate monthly social media reports and dashboards so teams can consistently make data-driven decisions. With clean, branded outputs, you’re not just sharing data-you’re fueling marketing impact.
On a final note
You’re streamlining growth by tracking real metrics across platforms, and that’s smart, consistent work, you’re syncing audio levels at -6 dB, stabilizing video at 1080p/60fps, and using mics like the Shure MV7 for crisp vocal clarity, testers confirm viewers stay 23% longer when lighting hits 1,000 lux, so invest in LED panels, leverage AI tools to auto-pull analytics, then build dashboards that show ROI at a glance, and finally, share actionable tweaks-like shortening intros by 15 seconds-to boost engagement fast, you’ve got the data, now move.